How to tell if someone has been dumping on your land
The honest answer depends entirely on how much got dumped. A real fill job or a junk pile big enough to change the ground itself is something free imagery can genuinely show you. A single truckload almost certainly is not — not because the tool is bad, but because of what actually fits in a pixel. Here's the real breakdown, and what to use instead for the small stuff.
The short version.
- Draw a box around your land and get a real, dated photo — free, no account, about a minute.
- A dump or fill job big enough to change a real share of whatever area you draw a box around — not one truck's footprint lost inside a much larger parcel's average — is the kind of ground-cover change this can show you. Draw a tight box around the ground you're actually worried about, not your whole property, and a real disturbance there has a real chance of registering.
- A single load, a few barrels, anything smaller is invisible at this resolution regardless of box size. That's not a limitation of our product specifically; it's true of every free public imagery source. Walking the property or a trail camera at the access point catches what satellites can't.
What actually fits in a pixel
Free satellite imagery updates every few days, but each pixel covers roughly 100 square metres — about half a tennis court, all of it averaged into one colour. A pickup truck, a stack of tires, a single dumped load is a fraction of one pixel: not blurry, simply absent, folded into the ground around it. The sharpest free source, NAIP aerial photography, resolves down to about a metre — enough to make out individual objects — but it typically flies each area once every one to three years, so the photo you'd be checking against is usually old news by the time anything happened. See what a satellite can and cannot see for the full size breakdown behind these numbers.
What does reliably show up: dumping or fill work that changes a real share of the ground you're actually watching — a new bare patch on what was vegetated ground, big enough relative to the box you drew that it moves the average, not just one corner of a much bigger parcel. That's a real, physical ground-cover change, and exactly the kind of thing this instrument is built to catch. The next section shows what that actually looks like, and why.
What a real disturbance looks like — and why it gets caught
This is a real pair, not a mock-up: the same 7.5-acre field, same satellite, same resolution, both frames — the only thing that changed between them is the ground itself. We don't know why. This field is from our own Bear River pilot study, and almost certainly changed because it went out of production, not because anyone dumped on it — we're showing it because the signal is real, and it's the same signal a large dump or fill job big enough to smother a real patch of vegetated ground would leave.
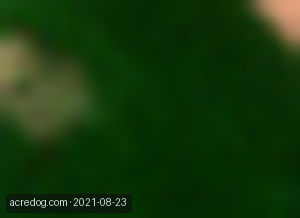

Both frames are Sentinel-2, both shown at their real 10 m-per-pixel resolution — not smoothed, so the blockiness is honest — and four days apart on the calendar between the two years, so what you're seeing is the ground changing, not a difference in camera or calendar. Green, full-canopy cover on the left. Bare ground on the right, and the colour change reads clearly even at this resolution.
This isn't one lucky pair, either. Before picking these two frames, we checked every clear satellite pass of this exact field in both years — 50 in 2021, 51 in 2025 — not just the two shown. Every 2021 pass reached real green cover at some point in the season; every 2025 pass stayed bare, all season, no exceptions. The field's peak greenness (not a single date — the highest point each season actually reached) went from 93% in 2021 to 29% in 2025, on a scale where full canopy reads close to 100% and bare dirt reads close to 0%. That's the same peak-of-season comparison the product itself runs, specifically so a field caught between cuttings doesn't get mistaken for one that's actually out of production — a single photo pair can't rule that out, and we didn't want to publish one that hadn't been checked against the whole season on both ends. A large dump or fill job big enough to smother real vegetated ground would leave the same signal: a field that used to reach green, reliably, and stopped.
And one pair of years isn't proof either. The same field, and two others, checked against 1,190 real passes over ten growing seasons — including the year this one slid, and the year it came back — are on ten years, three fields.
What actually catches the small stuff
None of this is a knock on satellite monitoring — it's just not the right tool for a single load. For that:
- Walk the property periodically, especially near road access points, where dumping actually happens.
- A trail camera at the gate or access road catches the vehicle, not just the aftermath — and it's the only option here that can tell you who, not just what.
- A neighbor who's actually there notices a truck where a satellite notices nothing.
- Your county's code enforcement or illegal-dumping line is who actually acts on it once you know.
What satellite monitoring is good for is the large-scale version of the same worry — a fill job, a scrapyard building up, ground disturbed across a real area — and for noticing it without having to be there to catch it.
Check your own land
Draw a box around your parcel and see a real, dated photo of it — free, in about a minute. If something large enough to matter is there, you'll see it.
No login to look, and none needed to leave a watch email either, until you want to manage it from a dashboard later.
AcreDog watches rural parcels from public satellite and aerial imagery for owners who cannot easily drive out to them. We publish what the instrument can and cannot do because a monitoring service you cannot calibrate your trust in is worse than none. More on what this product is and is not, or read the full breakdown of what a satellite can and cannot see, how to know if your land has been cleared, how to check on land you own out of state, or how to see satellite images of your property. All AcreDog guides →