How AcreDog avoids false alarms
"We don't cry wolf" is easy to put on a homepage. Here's what actually stands behind it on this one — three real fields, checked against 1,190 real satellite passes over ten growing seasons, the pictures themselves, and the real mechanisms between a noisy reading and an email in your inbox.
The short version.
- Every verdict compares a whole growing season's peak greenness, not one photo — a hayfield cut a week ago and a field that's genuinely gone idle can look identical in a single scene, and only a full season tells them apart.
- A verdict that changes from what you were last told doesn't reach your inbox on the strength of one recheck. It has to show up the same way on the very next one too, a week later, before we say anything.
- Both of those are real, running mechanisms, not marketing — the numbers below come from checking three of our own fields against every clear satellite pass in ten real growing seasons, not from hand-picked photos. In 27 real field-years, a same-week comparison would have raised 13 false alarms. Ours raised none.
A season, not a snapshot
A single satellite photo cannot tell a cut hayfield from an abandoned one — for a week or two after every normal cutting, an actively farmed field looks exactly as bare as one nobody's touched in years. So we don't compare photos. We compare each season's peak greenness — the highest point that field actually reached, across every clear pass we can get — against the same measurement from its earlier seasons: several of them, not just last year, so one odd year is never the whole yardstick. A field that reliably reaches full canopy and a field that reliably doesn't are separated by a real, physical difference this catches; a field between cuttings isn't.
And we don't call a season before it has had its chance. A field that is still brown in spring is usually just early — we have watched healthy fields stay bare well into early summer and reach full canopy by August. Until a season has had time to green up, we say so rather than compare it, because comparing a half-grown season against finished ones is how a service ends up telling you that a perfectly good field has gone idle.
Two checks, not one
Even a season-wide measurement can have an off night — a thin window of clear passes, a reading that lands right on a threshold. So a verdict that differs from what you were last told doesn't get emailed on that recheck alone. It has to show up again, unchanged, on the very next scheduled recheck before anyone hears about it.
The real cost of that, stated plainly rather than left out: rechecks run weekly, so requiring a second one to agree can add up to a week before a genuine change reaches your inbox. We'd rather be a week later and right than immediate and wrong.
What that actually looks like
This is a real field from our own Bear River pilot study, not a constructed example. Before trusting the two dated photos below, we checked every clear satellite pass of this exact field in both years — 50 in 2021, 51 in 2025 — not just two. The field's peak greenness went from 93% in 2021 to 29% in 2025, on a scale where full canopy reads close to 100% and bare dirt reads close to 0%. Every 2021 pass reached real green cover at some point in the season; every 2025 pass stayed bare, all season, no exceptions.
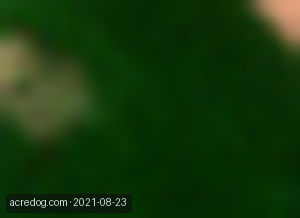
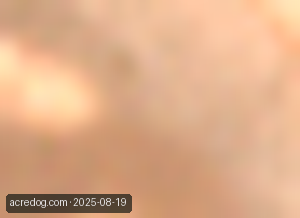
Both frames real, same source, same resolution, four days apart on the calendar between the two years.
And here is the part a single photo pair can't show: ten real passes from each season, not the two above, so you can see the pattern rather than take our word for two dates.
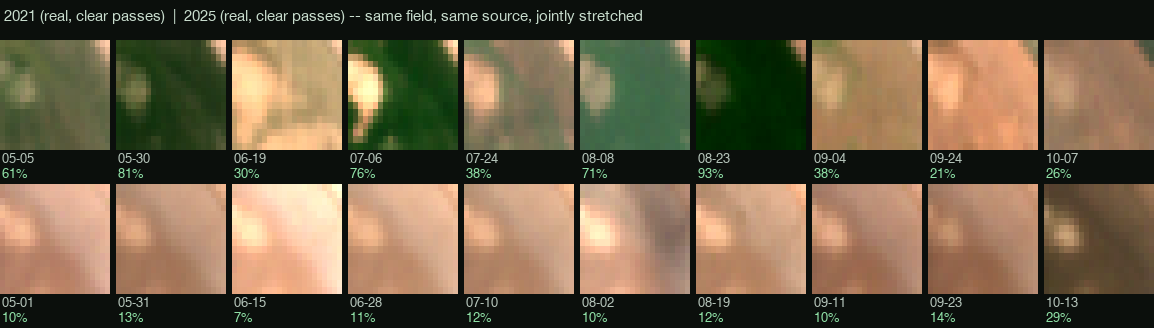
All 20 frames are the real satellite imagery, jointly stretched so brightness is directly comparable across every one of them — not independently brightened, which would let two unrelated photos read as more alike, or less, than they really are. We don't know why this specific field stopped being farmed — almost certainly an ordinary decision, not something wrong — only that the ground itself changed, consistently, across an entire season, not once.
Ten years, three fields
One field over two years is a good example. It isn't proof. So we went back and pulled every clear satellite pass of three of our own fields for ten growing seasons, 2017 to 2026 — 1,190 real passes — and asked two questions of each one: what would a naive service have told the owner that week, and what does ours say? Every picture below is the actual scene behind the number beside it, all of them brightened on one shared scale so a tile that looks greener really was.
A field that looks abandoned in April is usually just early
This is a wheat field that has been farmed every one of the ten years. In 2026 it stayed brown into late June — 16% greenness on April 4, still 35% on June 20 — and then went to 89% by the end of July and 93% in August. Nothing was wrong with it. It was late.

A service that compares this spring against last year's finished season sees bare dirt where there used to be a crop, and says so. Week by week, this is what that comparison says about the field above — twelve straight weeks of "stopped greening up", from mid-April to late June, then "never mind":

AcreDog sent nothing about this field. It waited for the season to have its chance, and by then the field was green.
A field going out of production slides; it doesn't fall
This is the field from the two dated photos above, across all ten years — the pass that set each year's peak. Watch the numbers: it didn't go from farmed to abandoned in one season. It slid, 93% to 82% to 76% to 40% to 29%, over four years. A comparison that only ever looks at last year sees a small step each time and never the slide. Looking at a field's history sees it plainly — and in 2026, when the same ground was farmed again and reached 97%, we'd tell you that too.

Every year, all three fields
The full picture: each year's peak greenness for all three fields. Two of them reach full canopy every single year — those are the fields a naive spring comparison keeps calling abandoned. The third is the one that really did go out of production, and came back.
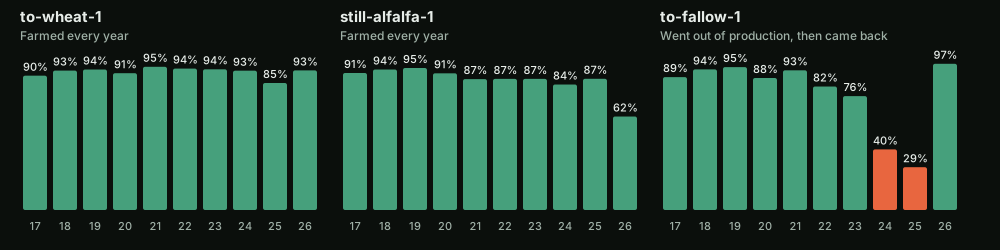
27 field-years in all: three fields, 2018 to 2026, with 2017 serving as history only. "Healthy" means the field reached full canopy at some point that year, which 26 of the 27 did. We don't know why the third field stopped being farmed for a while, only that the ground itself changed, consistently, across whole seasons. And this is three fields in one valley — it is the evidence we have, gathered the honest way, not a claim about every field everywhere. We'll keep adding to it.
Where this doesn't help
- A genuine, fast-moving change still takes up to a week longer to reach you than a system that alerts on the first reading. That's the real trade this page is making the case for, not a hidden cost.
- This is about ground cover, not small objects. A season-wide greenness comparison catches a field going out of production; it was never built to catch a single dumped load or a small disturbance — see how to tell if someone has been dumping on your land for what actually does and doesn't show up at that scale.
See it on your own land
Draw a box around your parcel and get the same real, dated look at it — free, in about a minute.
AcreDog watches rural parcels from public satellite and aerial imagery for owners who cannot easily drive out to them. We publish what the instrument can and cannot do because a monitoring service you cannot calibrate your trust in is worse than none. Read how to know if your land has been cleared or how to tell if someone has been dumping on your land, both of which use this same peak-of-season measurement. All AcreDog guides →