What a satellite can and cannot see on your land
Most pages that answer this are trying to sell you imagery, so they answer the flattering half. This is the whole answer, with the numbers, from a product that has to live with getting it wrong.
The short version. Free public imagery can reliably show you whether ground is vegetated or bare, across a whole field, from one year to the next. It can show you a sharp photograph of structures, ponds, roads and cleared timber — but that photo is often a year or more old.
It cannot tell you what is growing. It cannot see anything smaller than about a tennis court on the recent imagery. And it cannot tell you what happened last Tuesday.
Two sources, and the trade between them
Nearly every free answer to this question comes from one of two public datasets. They fail in opposite directions, and knowing which one you are looking at is most of the skill.
| Sentinel-2 (satellite) | NAIP (aerial) | |
|---|---|---|
| Detail | 10 m per pixel | 0.6–1 m per pixel |
| How often | Every ~5 days | Nominally every 2–3 years, often longer |
| Good for | What the land looks like now | What is actually on the land |
| Archive | Dense since 2017 | Back to roughly 2011 |
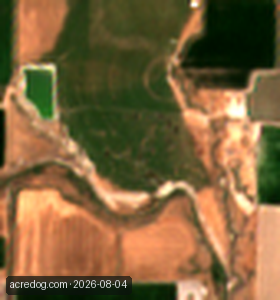
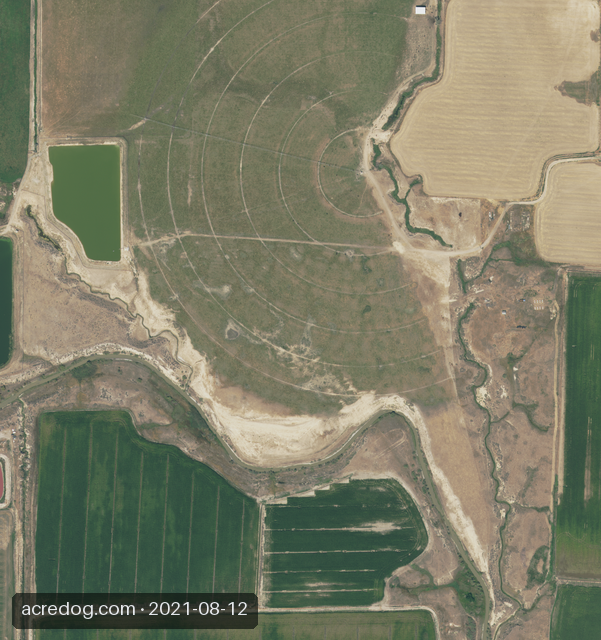
The same 183 acres, both real, both free, taken about five years apart — and shown at the same width on purpose. Neither is the “better” picture. The left one can tell you what is happening now and almost nothing about what is there; the right one can tell you what is there and nothing at all about this year.
So there is no single "satellite view of your property." There is a coarse picture from a few days ago and a sharp picture from a while back, and any honest tool shows you the capture date on both.
The size question: what fits in a pixel
A 10-metre pixel covers 100 square metres — about half a tennis court. Everything inside it is averaged into a single colour. So on the recent satellite view:
- A 200-acre parcel is roughly 90 pixels across. That is enough to see a field, its shape, and whether it is green.
- A pickup truck, a person, a survey stake or a dumped load of tyres is a fraction of one pixel. Not blurry — absent. Averaged into the ground around it.
- A new shed or gravel pad might be one to three pixels. You may see a smudge. You will not see a shed.
The 1-metre aerial photo is a different instrument entirely: fence lines, individual trees, a truck in a yard, the edge of a clearcut. The catch is the date, and it is usually worse than the nominal flight cycle suggests. The newest aerial photograph of our own demo parcel in northern Utah was flown in August 2021. The archive there runs 2011, 2014, 2016, 2018, 2021 — so on that ground the sharpest available picture is five years old, and nothing about this year is in it.
The thing it genuinely cannot do, and we measured it
The single most common assumption is that satellite imagery can tell farmed ground from unfarmed ground. It is the assumption we would most like to be true, and the one we can least support.
The measure everyone uses is NDVI — how strongly the ground reflects near-infrared, which is a good proxy for live green leaf. A crop in full canopy scores high. Bare dirt scores low. So far so useful.
But a field nobody planted does not stay bare. In anywhere that gets rain it fills with volunteer wheat, johnsongrass, pigweed and ryegrass, and closes canopy just like a crop. We went and measured it:
| Genuinely idle ground (n=3) | 0.441 – 0.684 |
| Actively farmed fields (n=6) | 0.740 – 0.882 |
| Where bare fallow sat when the threshold was set | 0.139 – 0.259 |
Idle ground in the Delta reads 0.441 to 0.684 — nowhere near bare. The line this product uses to call ground "in crop" sits at 0.399, and it was drawn against fallow fields in an irrigated Utah valley that measured 0.139–0.259, because there nothing grows without irrigation. Every one of the Delta's idle fields is above that line. The instrument was calibrated on bare ground and then asked about ground where it rains.
So the honest statement is narrower than "the numbers are identical", and worth stating precisely: greenness measures whether something is growing, not whether anyone planted it. Wheat and volunteer wheat are the same plant. A field that has quietly gone out of production in a wet climate closes canopy like a crop, and the number we would have to rely on to notice was set somewhere it never happens.
Three fields is a small sample and we will say so rather than round it up. An earlier version of this page cited six, on a wider range, and that was our error: those boxes were picked by a single USDA land-cover reading at the centre point, and on re-checking the whole box, three of them turned out to be mostly soybeans, cotton and wetland timber rather than idle ground. The three above are the ones that survived the check.
The time question: what "recent" means
Satellites photograph; they do not watch. Sentinel-2 passes over roughly every five days, and cloud takes some of those, so the newest clear view of your land is typically days to a few weeks old. That is genuinely recent. It is not live, and nothing free is.
This matters most for events. A fire, a flood, a bulldozer: the satellite may catch it within a week. But if you want to know what happened on a particular afternoon, no public imagery will tell you, and any product that implies otherwise is describing a capability that does not exist at this price.
What this means for change alerts
AcreDog emails you when your parcel's ground cover changes between growing seasons. Since this page is about being straight, here is exactly what that does and does not include — including the parts that surprise people.
It can tell you the ground went from green to bare, or bare to green
Across a whole parcel, comparing one season's peak greenness to the next. That is a real, large, physical change and it is what the alert is for.
It cannot tell you your field is greening less than it used to
This is the one people assume away. A parcel whose peak greenness falls from 0.88 to 0.45 — a 49% drop — produces no email at all, because both of those are still "vegetated". The alert fires on crossing between green and bare, not on a decline within green.
A partial change usually will not trip it
The measure is an average over your whole box. A one-acre patch on a 40-acre field moves that average by about 0.016. Roughly 60% of a parcel has to go bare before the average crosses. A new pad, a shed, a small slide: visible in a photograph, invisible to the alert.
Early in the year, "bare" can mean "not planted yet"
The comparison is last year's full season against this year's season so far. Checked in May, "so far" is about seven weeks, and a field that is simply not up yet looks like a field that stopped greening. Read a spring reading as a spring reading.
On non-farm ground there is no verdict at all
If USDA's Cropland Data Layer reads your parcel as mostly non-agricultural — timber, range, a rural homesite — we decline to issue a crop verdict rather than inventing one. You still get the photographs. You do not get a green-versus-bare judgement, because on that ground it would not mean what it sounds like it means.
So what is actually worth doing
For most landowners the useful thing is not an alert. It is the pair of dated photographs: the clearest recent satellite view of your ground, and the sharpest aerial photo ever flown over it, each stamped with when it was taken. That answers "what does my land look like, and what did it look like before" — which is the real question behind most of the ones people type.
It is free, it needs no account, and you can have it in about a minute.
AcreDog watches rural parcels from public satellite and aerial imagery for owners who cannot easily drive out to them. We publish what the instrument can and cannot do because a monitoring service you cannot calibrate your trust in is worse than none. More on what this product is and is not. All AcreDog guides →